
Full lab report structure
How the results section fits into the whole report, section by section.
Not sure where to start? Talk to our support team live.

Lab Reports
The results section is where students most often lose marks — either by dumping raw data or by slipping in interpretation that belongs in the discussion. This guide shows what to include, how to present it, and where the line falls.
The short version
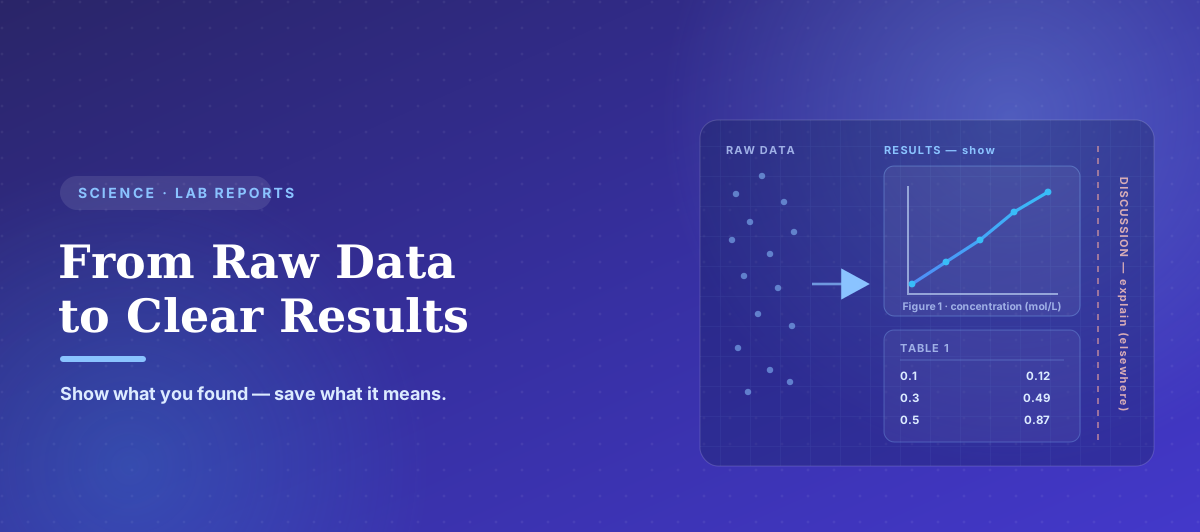
The results section of a lab report presents your findings clearly and objectively — the key data, tables and figures — without interpreting them. You report what happened (values, trends, statistical outcomes) and guide the reader through it in text, while saving what it means, and why, for the discussion. Keeping that line clear is what earns marks.
On this page
Start here
The results section has one job: to present what you found, clearly and objectively, so the reader can see the evidence for themselves. It reports the key data — values, trends, statistical outcomes, and the tables and figures that show them — but it does not explain what they mean, why they happened, or how they compare to the literature. That interpretation belongs in the discussion. Getting this boundary right is the single biggest thing separating a mid and a high mark. If you are writing up a science, health or engineering report and want to see what a strong section looks like in your field, My Perfect Writing’s environmental science assignment help can show you the standard UK markers expect.
This guide covers just the results section. For the full report shape, see how to write a lab report, section by section; for the half that interprets your data, see writing the discussion section.
Integrity first Report the data you actually collected. Presenting results honestly — including the ones that did not go to plan — is part of the science, and part of the marks.
The line that matters
Here is the test for every sentence in your results section: am I showing, or explaining? Showing belongs here; explaining belongs in the discussion.
The first states what happened; the second says what it means. Interpretation, comparison to expected values, and error explanations all wait for the discussion. If you find yourself writing "because", "this shows that", or "this was likely due to", you have probably crossed the line — the description-versus-analysis distinction that runs through all UK marking, explained in what markers actually want.
How to present it
| Use a table when… | Use a figure when… | Avoid |
|---|---|---|
| Exact values matter and must be read precisely | A trend, relationship or comparison matters more than exact values | Showing the same data as both a table and a figure |
| You have several variables or conditions to line up | A pattern over time or across a range is the point | Charts with no axis labels or units |
| Readers need to reuse the numbers | A shape (peak, plateau, correlation) tells the story | 3-D effects or clutter that hide the data |
Every table and figure needs a number and a self-contained caption, and must be referred to in the text (e.g. “as shown in Figure 2”).
Precision
Report values with the right units and a sensible number of significant figures — matching the precision of your measurement, not your calculator’s display. Where you ran statistics, state the test, the value and the significance clearly (for example, the test statistic and its p-value), and put full data tables in an appendix rather than the body if they are long.
Consistent, precise reporting is a marking criterion in its own right. If you are unsure how to phrase a result formally, the University of Manchester’s Academic Phrasebank gives standard ways to report findings without slipping into interpretation.
Guide the reader
A results section is not just tables and figures dropped onto a page — it needs a short guiding text that walks the reader through the data in a logical order, usually following your research question or hypotheses. Each paragraph points to the relevant figure or table, states the key result in words, and moves on. The visuals carry the detail; the text carries the thread.
Keep it in the past tense and impersonal, and resist commentary. For discipline-specific conventions on structure and presentation, Purdue OWL’s guidance on writing in the sciences is a useful reference — but always defer to your own module’s lab report brief.
Check your own write-up
Marker’s Eye reviews your own lab report against UK marking criteria — whether your results are presented objectively, whether interpretation has leaked in from the discussion, and whether your figures and referencing hold up. You make the edits; every word stays yours.
Avoid these
Presentation and referencing are marked too, so keep citation style consistent throughout — our guide to Oxford vs Harvard referencing helps if your report cites sources. For technical and engineering write-ups specifically, My Perfect Writing’s engineering management support focuses on the same standards UK markers assess.
Before you submit
Run this on your own draft before you hand it in.
Questions
Before you submit
Use this guide to present your data cleanly, then let Marker’s Eye check your own draft against UK marking criteria — objectivity, the results-versus-discussion line, and evidence — before you hand it in.
Guidance should support learning, not replace authorship.